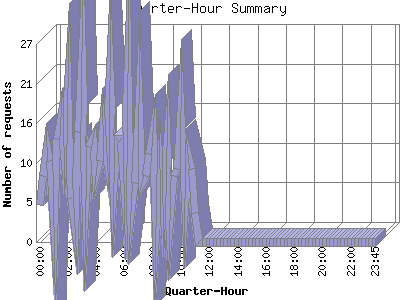
The Quarter-Hour Summary shows an overview of site activity over the course of a day, broken down into fifteen-minute intervals. If your report has enough traffic this will give you a detailed graph of your site's load throughout the day.
| Quarter-Hour | Number of requests | Number of page requests | |
|---|---|---|---|
| 1. | 00:00 | 5 | 2 |
| 2. | 00:15 | 9 | 5 |
| 3. | 00:30 | 13 | 6 |
| 4. | 00:45 | 11 | 4 |
| 5. | 01:00 | 2 | 0 |
| 6. | 01:15 | 14 | 8 |
| 7. | 01:30 | 17 | 8 |
| 8. | 01:45 | 13 | 5 |
| 9. | 02:00 | 21 | 10 |
| 10. | 02:15 | 6 | 2 |
| 11. | 02:30 | 2 | 1 |
| 12. | 02:45 | 15 | 5 |
| 13. | 03:00 | 26 | 15 |
| 14. | 03:15 | 6 | 2 |
| 15. | 03:30 | 13 | 7 |
| 16. | 03:45 | 14 | 3 |
| 17. | 04:00 | 9 | 4 |
| 18. | 04:15 | 11 | 4 |
| 19. | 04:30 | 16 | 8 |
| 20. | 04:45 | 12 | 4 |
| 21. | 05:00 | 22 | 9 |
| 22. | 05:15 | 8 | 2 |
| 23. | 05:30 | 14 | 8 |
| 24. | 05:45 | 14 | 5 |
| 25. | 06:00 | 8 | 2 |
| 26. | 06:15 | 23 | 11 |
| 27. | 06:30 | 4 | 2 |
| 28. | 06:45 | 8 | 3 |
| 29. | 07:00 | 19 | 8 |
| 30. | 07:15 | 8 | 3 |
| 31. | 07:30 | 9 | 4 |
| 32. | 07:45 | 12 | 4 |
| 33. | 08:00 | 15 | 5 |
| 34. | 08:15 | 2 | 1 |
| 35. | 08:30 | 10 | 5 |
| 36. | 08:45 | 5 | 1 |
| 37. | 09:00 | 13 | 4 |
| 38. | 09:15 | 3 | 1 |
| 39. | 09:30 | 9 | 5 |
| 40. | 09:45 | 10 | 5 |
| 41. | 10:00 | 18 | 7 |
| 42. | 10:15 | 6 | 3 |
| 43. | 10:30 | 12 | 5 |
| 44. | 10:45 | 10 | 6 |
| 45. | 11:00 | 4 | 1 |
| 46. | 11:15 | 0 | 0 |
| 47. | 11:30 | 0 | 0 |
| 48. | 11:45 | 0 | 0 |
| 49. | 12:00 | 0 | 0 |
| 50. | 12:15 | 0 | 0 |
| 51. | 12:30 | 0 | 0 |
| 52. | 12:45 | 0 | 0 |
| 53. | 13:00 | 0 | 0 |
| 54. | 13:15 | 0 | 0 |
| 55. | 13:30 | 0 | 0 |
| 56. | 13:45 | 0 | 0 |
| 57. | 14:00 | 0 | 0 |
| 58. | 14:15 | 0 | 0 |
| 59. | 14:30 | 0 | 0 |
| 60. | 14:45 | 0 | 0 |
| 61. | 15:00 | 0 | 0 |
| 62. | 15:15 | 0 | 0 |
| 63. | 15:30 | 0 | 0 |
| 64. | 15:45 | 0 | 0 |
| 65. | 16:00 | 0 | 0 |
| 66. | 16:15 | 0 | 0 |
| 67. | 16:30 | 0 | 0 |
| 68. | 16:45 | 0 | 0 |
| 69. | 17:00 | 0 | 0 |
| 70. | 17:15 | 0 | 0 |
| 71. | 17:30 | 0 | 0 |
| 72. | 17:45 | 0 | 0 |
| 73. | 18:00 | 0 | 0 |
| 74. | 18:15 | 0 | 0 |
| 75. | 18:30 | 0 | 0 |
| 76. | 18:45 | 0 | 0 |
| 77. | 19:00 | 0 | 0 |
| 78. | 19:15 | 0 | 0 |
| 79. | 19:30 | 0 | 0 |
| 80. | 19:45 | 0 | 0 |
| 81. | 20:00 | 0 | 0 |
| 82. | 20:15 | 0 | 0 |
| 83. | 20:30 | 0 | 0 |
| 84. | 20:45 | 0 | 0 |
| 85. | 21:00 | 0 | 0 |
| 86. | 21:15 | 0 | 0 |
| 87. | 21:30 | 0 | 0 |
| 88. | 21:45 | 0 | 0 |
| 89. | 22:00 | 0 | 0 |
| 90. | 22:15 | 0 | 0 |
| 91. | 22:30 | 0 | 0 |
| 92. | 22:45 | 0 | 0 |
| 93. | 23:00 | 0 | 0 |
| 94. | 23:15 | 0 | 0 |
| 95. | 23:30 | 0 | 0 |
| 96. | 23:45 | 0 | 0 |
This report was generated on February 10, 2009 11:03.
Report time frame February 10, 2009 00:05 to February 10, 2009 11:02.